I have been developing a syllabus for a course in personal futurity.
My personal research project at present is a study of Voronoi diagrams as a way to measure poetic quality.
Here are a few discoveries so far in my preliminary I-Search:
Question #1: What does the following text/poem resemble in a Voronoial diagram where each vowel is one point.
The oscillating
and amplifying
fan of play
having begun
never ends.
Answer #1: According to ChatGPT this is the Voronoial diagram that is generated.

Question #2: What might these Voronoial diagrams signify for the explication of the poem?
Answer #2:
A Voronoi diagram is a way of dividing space into regions based on distances to a specific set of points. It’s a concept used in computational geometry and has practical applications in fields like geography, biology, and data science. I wish to extend their use to poetic analysis. One of the basic principles of futurity work is to identify what are known as “weak signals” of change. Jane McGonigal notes that there are ‘trends’ of varying strength: signals (early stage indicators), patterns (where signals repeat and amplify), or movements (when signals reach critical mass). Another way of thinking about this is to become increasingly aware of peripheral adjacencies and anomalies. Using Voronoial Diagrams might be a way to look at quality in a peripheral way.
This is not a lesson in abstraction. It is about a phenomenon that is ubiquitous in nature from the expression of melanin in giraffe spots to the patterns in a garlic cut on the crossection. It is also a foundational tool in facial recognition, in constructing 3D model for computer animations, and in terrain analysis in GIS analyses.
Key Concepts:
- Seed Points:
- These are the input points, also called “sites,” around which the Voronoi regions are built.
- Each seed point has a region associated with it.
- Voronoi Region:
- The region associated with a seed point consists of all the locations in the plane that are closer to that seed point than to any other.
- These regions are convex polygons in 2D space.
- Voronoi Edges:
- The boundaries of the regions, which are equidistant from the nearest two seed points.
- These are straight lines in 2D but can be more complex in higher dimensions.
- Voronoi Vertices:
- Points where three or more edges meet. These are equidistant from three or more seed points.
How It Works:
- Imagine dropping a pebble at each seed point and watching the ripples expand outward. Where ripples from different points meet, you draw a boundary. This creates a Voronoi diagram.
Applications:
- Geography:
- Modeling territories (e.g., the closest fire station or hospital for any location).
- Biology:
- Studying patterns like the distribution of cells or animal territories.
- Computer Science:
- Pathfinding, spatial partitioning, and network design.
- Art and Design:
- Generating patterns and textures, or abstract visualizations like the one we created.
Each vowel represents a seed point, and the space is divided into regions based on proximity to those vowels. The visualization highlights how space is partitioned according to these points.
Question #3: How can this diagram be used to measure the quality of the poem?
Answer #3:
Some might consider that using a Voronoial diagram to measure the “quality” of a poem is an unconventional approach, as it connects spatial geometry to poetic analysis, but recall that what I am also considering how to practice a ‘peripheral vision’ strategy of looking beyond the obvious as I track the anomalies, signals, and adjacencies as they pop up in my morning feldgangs (fieldwalks) and woolgatherings.
So, here’s some ways Voronoial diagrams could be interpreted and used:
1. Spatial Distribution of Vowels:
- Balanced Distribution: A poem with evenly spaced vowels in its text might produce a more balanced Voronoi diagram, which could metaphorically represent harmony or fluidity in the poem.
- Clustered Regions: If many vowels cluster together, this might suggest a rhythmic or phonetic density in certain parts of the poem, potentially creating areas of emphasis or intensity.
2. Phonetic Density and Flow:
- Voronoi regions that vary significantly in size can hint at uneven phonetic patterns. Large regions may correspond to sparse vowel usage, while smaller regions reflect denser phonetic “hotspots.”
- This could be tied to the poem’s rhythm, cadence, or its visual impact when read aloud.
3. Vowel Richness as a Proxy for Musicality:
- In poetry, vowels often contribute to euphony (pleasantness of sound) or cacophony (harshness of sound). The Voronoi diagram, when analyzed for patterns of vowel proximity, can highlight areas where the poem’s musicality or harshness is concentrated.
4. Visual Aesthetics and Structure:
- If the Voronoi diagram is visually pleasing (e.g., symmetrical or balanced), it might resonate with how well the poem feels structured or composed.
- A chaotic diagram might reflect thematic chaos or tension in the poem, which could be intentional based on the poem’s message.
5. Thematic Connection:
- A Voronoi diagram can be interpreted metaphorically. For example:
- A poem about fragmentation or isolation might have sparse, disconnected vowel regions.
- A poem about unity or connection might exhibit tighter clustering or overlaps.
6. Comparing Multiple Poems:
- Voronoi diagrams could be used to compare poems, looking for patterns in vowel distributions that correspond to different authors, styles, or themes.
- A “metric” could be defined based on the distribution, symmetry, or area size variability of the regions.
Practical Example:
For the given poem:
- Small, tightly packed regions may reflect the intense use of vowels in quick succession, as seen in phrases like “oscillating and amplifying.”
- Larger, sparse regions could correspond to pauses or moments of reflection, like “never ends.”
By analyzing these features, one could align the diagram with poetic qualities such as rhythm, tone, or mood, enriching the understanding of the poem’s “quality” in a novel way.
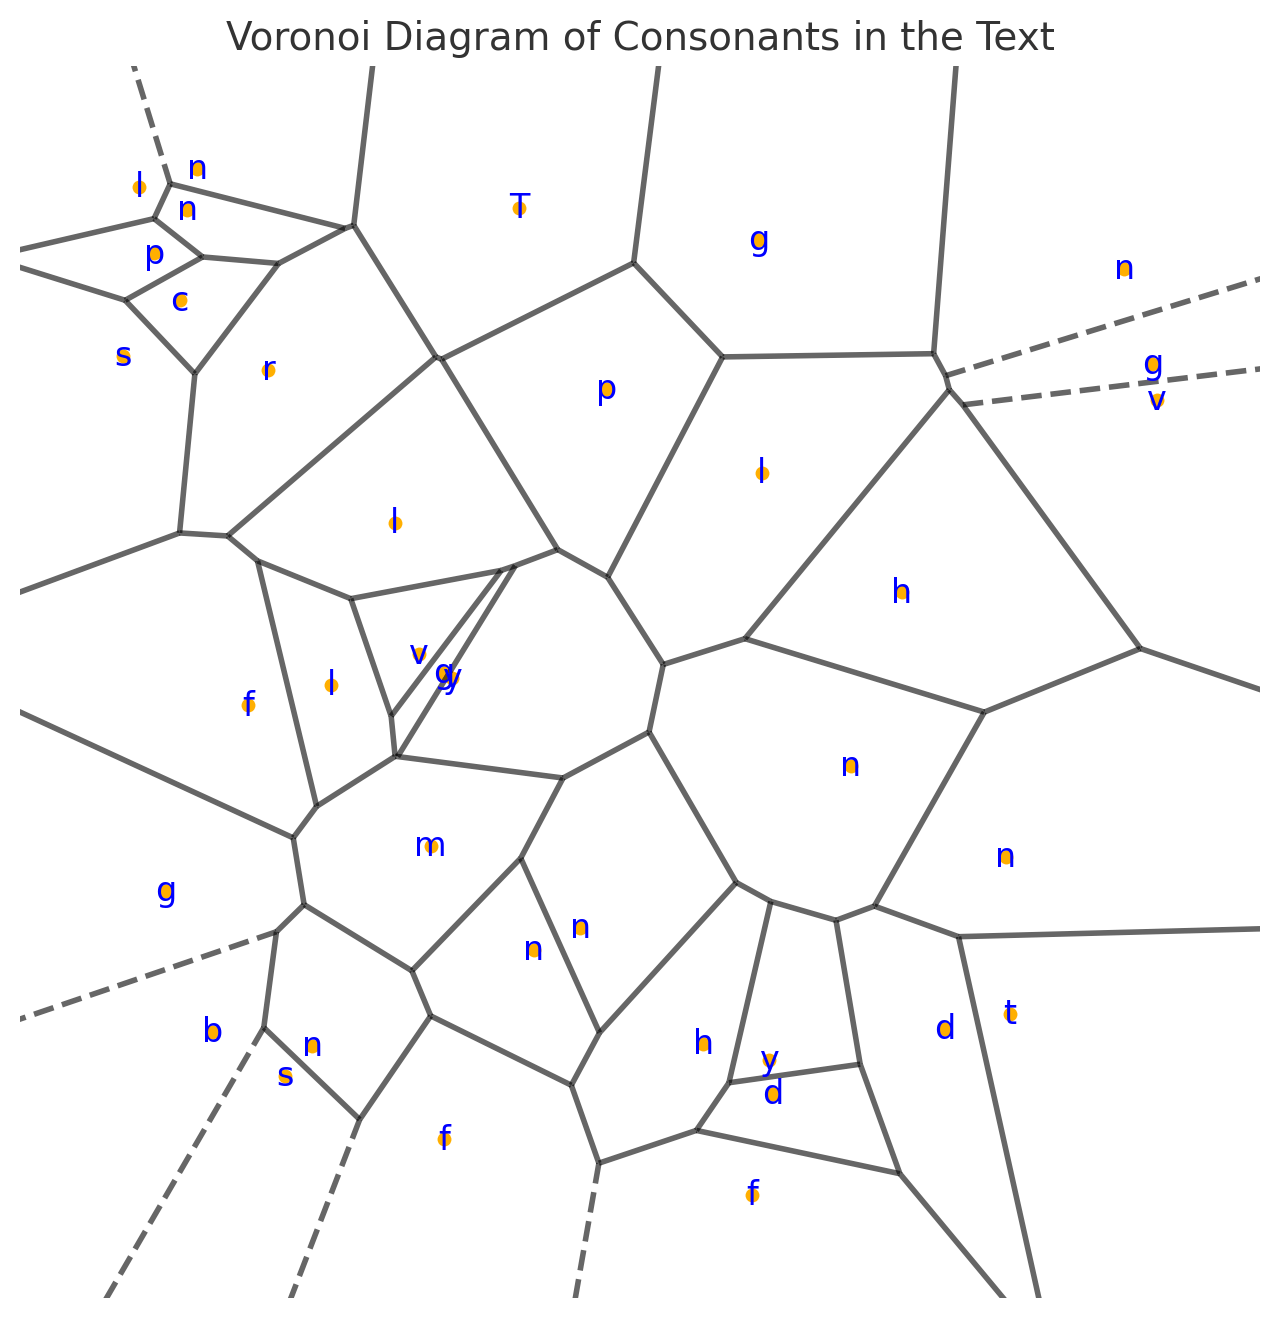
And, of course, this analysis begs the question, “Can consonants be anaylzed in the same way? Yes.
I reckon this is the kind of work that fits retirement very well, n’est-ce pas.
Permalink //
Interesting explorations (as usual).
“Imagine dropping a pebble at each seed point and watching the ripples expand outward. Where ripples from different points meet, you draw a boundary. This creates a Voronoi diagram.”
I love this as metaphor. It was via Chat? Man.
Kevin
Permalink //
Another musical rabbit hole, in which I took that description and used it as a reference point for a piece of music (and via Firefly image, construction with the text description as its prompt).
https://www.youtube.com/watch?v=yUxlifMnhds